
Expecting the Unexpected


“No man is so brave that he is not disturbed by something unexpected.” – Julius Caesar
The idea of investing for the long-term sounds easy in theory. However, it can be a difficult concept for clients to internalize when they are in the heart of a volatile market. “This too shall pass” may be true, but it is hardly reassuring to a client watching their portfolio’s value when it feels like the bottom is falling out.
At First Ascent we believe strongly in the valuable roll of financial advisors as educators and coaches to their clients. We also believe that as portfolio managers we can help in that cause by creating analysis and tools for advisors to help clients stay invested and stick to their financial plans.
Below is an analysis showing the historical range of returns for the S&P 500 from 1988-2017. As you’d expect, the chart creates a funnel as returns become more stable and predictable with a longer time horizon (which is why we call this a “funnel chart”).
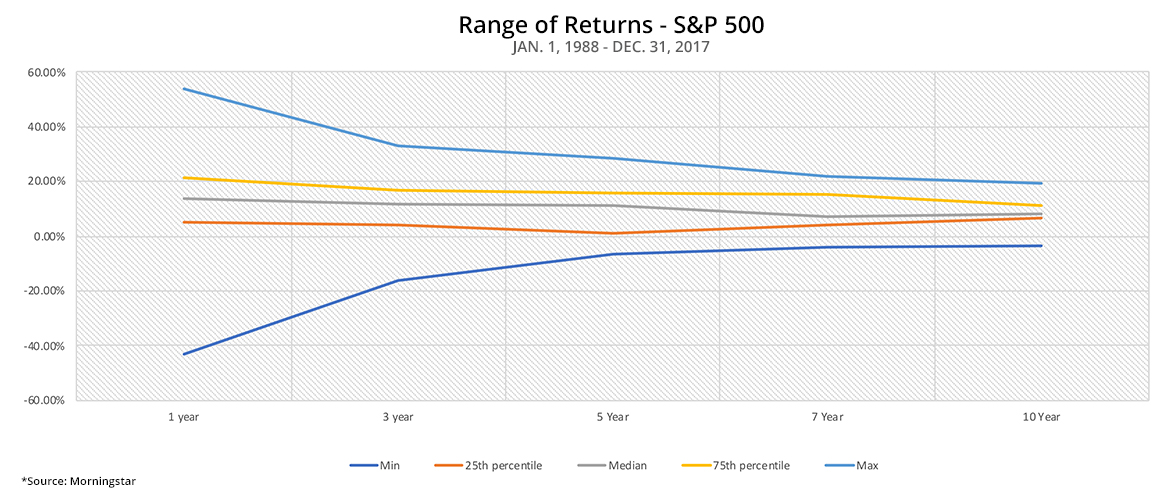
The blue lines show the absolute max and min of returns over this period. We’ve clearly seen some black swan events that make for exciting (or terrifying) 12-month periods, with the worst single year posting a -43.32% drop.
However, by year two those best and worst-case scenarios begin to converge sharply as returns start reverting to the mean. Imagine how terrible it would feel to be the investor at the bottom of the blue line during year one who gets out of the market and misses the ride back up?
The second take-away I found useful in this chart is just how consistent the return patterns are between the 25th and 75th percentile. That band makes up a majority of the time, during which the market is puttering along relatively stably and is positive over all time periods shown. I can see many investors getting lulled into a sense of security and comfort. However, every investor in the markets over this period also experienced every one of those single year events, whether the market was down -43% or up 54%.
I don’t know what the next 30 years will hold, but I imagine it will still look something like this chart. We’ll see periods of stability interrupted by dramatic market movements, both up and down, that shock and surprise investors. That battle is about training clients ahead of time to expect that those extremely volatile times will happen. Once you know they’re coming (at some point) they’ll be at least a little less unexpected, and we can all be a little less disturbed.