
Chasing Yield (Off a Cliff?)


It is not uncommon for advisors or their clients to ask about creating a certain level of yield in a portfolio, saying something like “I need a portfolio that yields 4% or 5% as that is what I plan to withdraw.” It is also not uncommon to see investment strategies tailored to these requests. After all, the investment industry is exceptional at providing strategies that people think they want. Sometimes, though, it may be better to spend a little time on education and see if there is a better solution to address a specific need.
At First Ascent, we believe in a total return approach to investing. A total return approach looks at the sum of both capital gains and income, as opposed to heavily focusing on one piece over the other. Income is only a piece of a larger equation: Income + Capital Gains = Total Return. Investors can create their own “income” as needed by spending capital gains. For taxable accounts, spending long-term capital gains is often more tax-efficient as well.
We think this concept is important, especially in the current environment. Reaching for yield can add a meaningful amount of risk to client portfolios and reduce diversification. Focusing on income targets can lead investors to over-concentrate in certain asset classes and add unnecessary and sometimes unintentional risks to their portfolios.
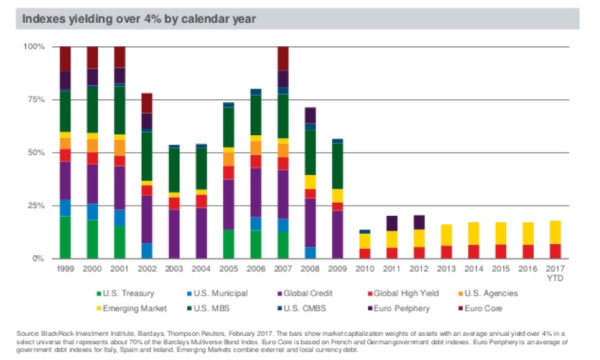
The following chart shows the availability of fixed income assets yielding over 4%. As you can see, in the late 1990s or early 2000s, building a 4% income portfolio would have been simple, as essentially all fixed income assets yielded 4% or more.
Today, however, less than 20% of the fixed income market pays a yield above 4%. The portion that does is limited to high yield and emerging market debt. These are two asset classes that do not behave in the same manner as high quality fixed income. High yield and emerging market debt have much higher correlations with equities and more overall risk. For example, in 2008 while the Barclays Aggregate Bond Index returned approximately 5%, high yield and emerging market debt returned negative 26% and 11%, respectively. That is drastically different than the capital preservation that most investors desire from their fixed income allocations.
Here’s another perspective on the same issue. Going back to 2006 and comparing it to 2016, this graphic depicts the portfolio volatility that an investor would be exposed to based on targeting certain levels of income.
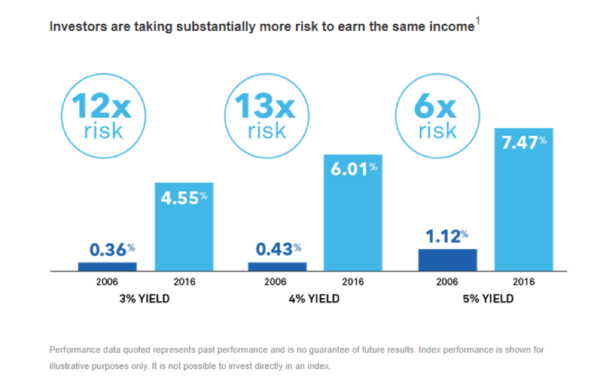
For example, in 2006, all it took was investing in a money market fund to reach a 4% yield, with very minimal volatility. By 2016, however, it would require an allocation of 63% to core bonds and 37% to high yield, requiring an investor to assume a volatility that is 13 times higher than what was required just 10 years before.
We believe that instead of focusing exclusively on yield, portfolios designed to capture the desired total return potential are superior strategies for balancing risk and return.
It is important to note that this is not just a problem with yield. The truth is that we are likely investing in a lower expected return environment. We think investors need to set their expectations for future returns to levels lower than the long-term historical returns of the markets. No one can control what the capital markets will generate, but investors can control their savings rate, their risk exposures, their behaviors, and make informed risk/return decisions based on their objectives and goals.
1 Source: Morningstar. As of 12/31/16. For illustrative purposes only. Illustration assumes an investment universe of Money Funds, Core Bonds and High Yield Bonds represented by the Morningstar Taxable Money Market Funds category, Barclays US Aggregate Bond Index and Barclays US High Yield 2% Issuer Capped Index, respectively. Allocations determined by portfolio mix that achieves stated yield target with lowest level of risk. Risk represented by trailing 10-year annualized standard deviation. The hypothetical 3% Income Portfolio in 2006 consisted of a 68% allocation to Money Funds and the remainder allocation is not invested. In 2016 that allocation was 83% Core Bonds and 17% High Yield Bonds. The hypothetical 4% Income Portfolio in 2006 consisted of a 91% allocation to Money Funds and the remainder allocation is not invested. In 2016 that allocation was 63% Core Bonds and 37% High Yield Bonds. The hypothetical 5% Income Portfolio in 2006 consisted of a 75% allocation to Money Funds, 12% to Core Bonds and 13% to High Yields bonds. In 2016 that allocation was 43% Core Bonds and 57% High Yield Bonds.